| Home | Breakout Pullback |
PTS Indicator | PTS Trader Strategy |
NinjaTrader | Automated Trading |
Beginners Info |
Pricing | FAQs | ETS Blog | Member Login |
|
Emini Trading Strategies Tick Trader® Professional Indicator Version 2
EminiTradingStrategies.com is proud to release ETS ProIndicatorV2 software! ETS ProIndicatorV2 Software is an optional purchase for students of my Day Trading Course. It's a great trading tool as it knows all of our trade setups as well as our "No-Zone" rules. Whether you day trade the Emini S&P or the Emini Dow Strategy, ProIndicatorV2 will be a great tool to trade with! In our online emini trading course, we teach the setups, the rules, when to enter and when to exit. More importantly, we teach when not to take trades! Having the discipline to not take trades is just as important as taking them! This feature packed indicator will not only accelerate your learning curve, but also acts as an excellent visual aide illustrating the natural progression of our trade set-ups. We all want to be successful with our online day trading. ETS ProIndicatorV2 can help! Let me show you a couple screen shots: 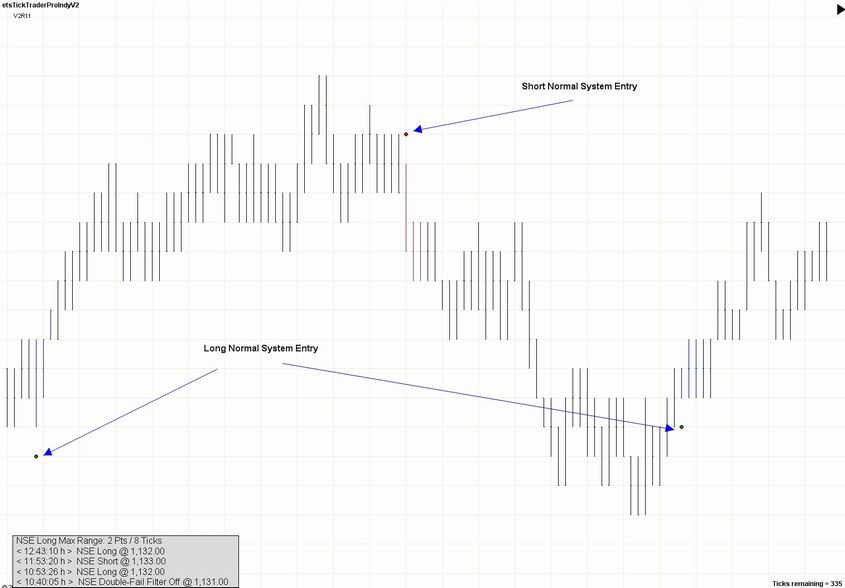
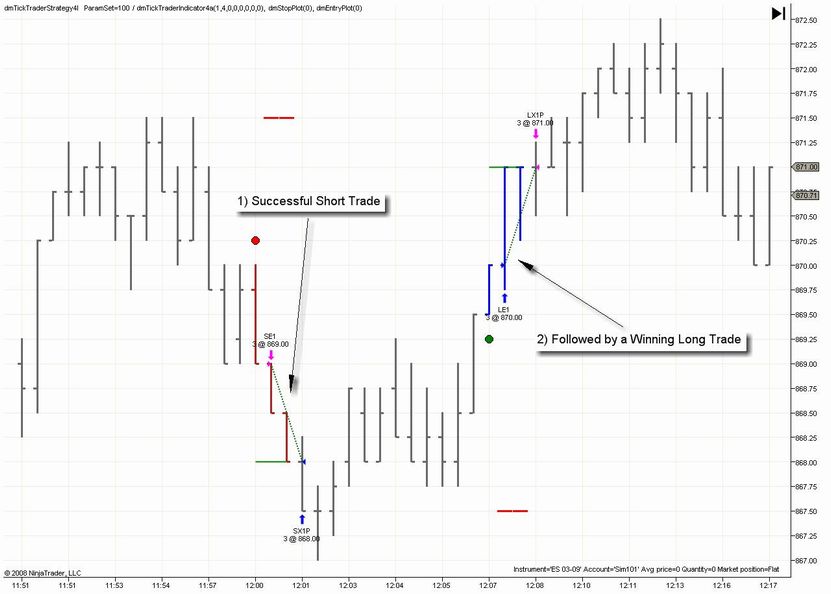
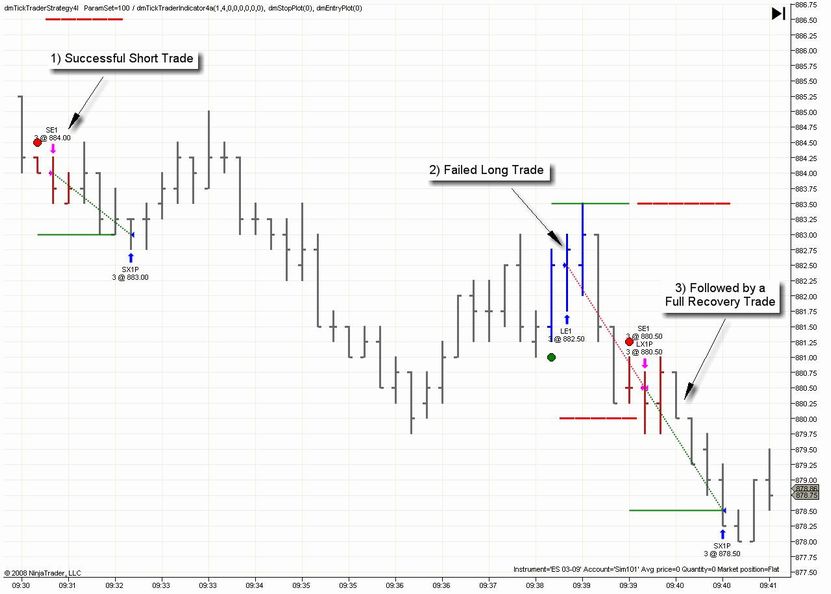
Above, we have a screen shot of the Emini S&P Market. On the bottom left hand corner is our Message Center which illustrates both real time and historical trade set-ups in addition to other pertinent information needed to successfully trade our methodology! The green dots show our Long Normal System Entry trade. Notice the 3 blue bars as well just above the green dots. The red dots signal our Short NSE Trade. Notice the 3 red bars as well. Here's a screen shot of ProIndicatorV2 showing you when not to take day trades: 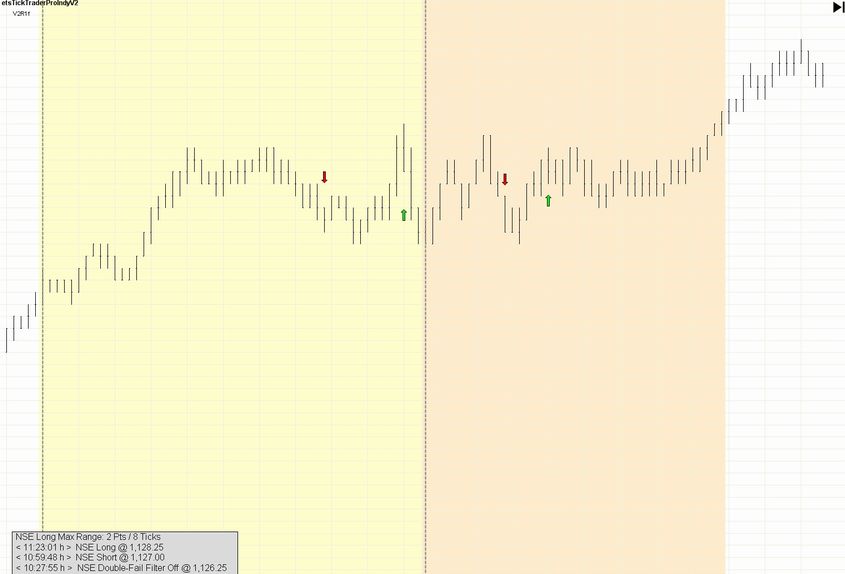
Notice the yellow and orange back color. These colors correspond with existing rules taught in our S&P Emini Day Trading Course. This is called "No-Zone." During No-Zone we do not take our NSE Trade (Normal System Entry) as it is considered a lower probability trade. ProIndicatorV2 even suppresses the green and red dots for you as they are not valid during this time. In the chart above, we superimposed arrows where the long and short NSE trades would have signaled had they not been suppressed by our No Zone! Of course, we teach the No Zone rules in our Emini Trading System, but the back coloring combined with the suppression of the NSE "show me" dots are a fantastic learning tool! One of our favorite trading strategies is taking NSE trades when we come out of No Zone. These trades have a higher percentage win ratio over a standard NSE trade. We love to day trade the NSE coming out of No Zone, or take our EET, another day trading strategy taught in our online trading course. Here's a screen shot: 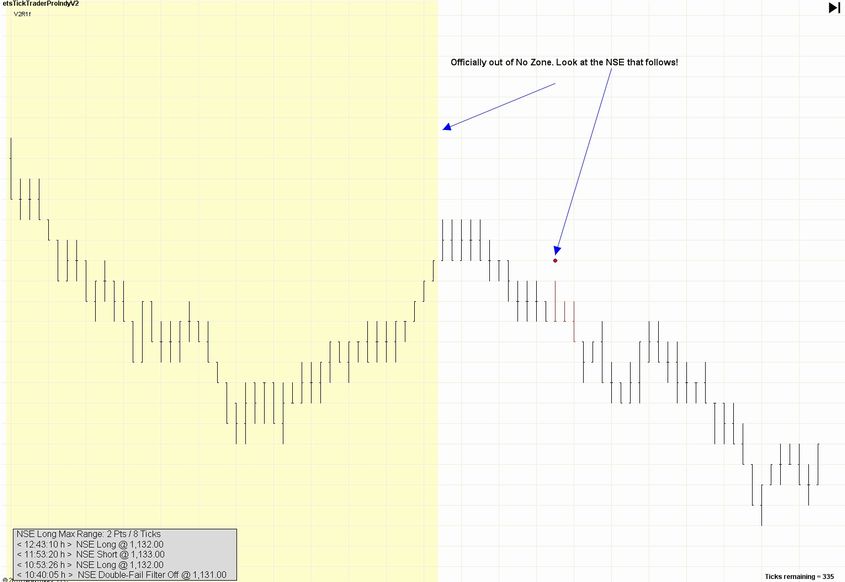
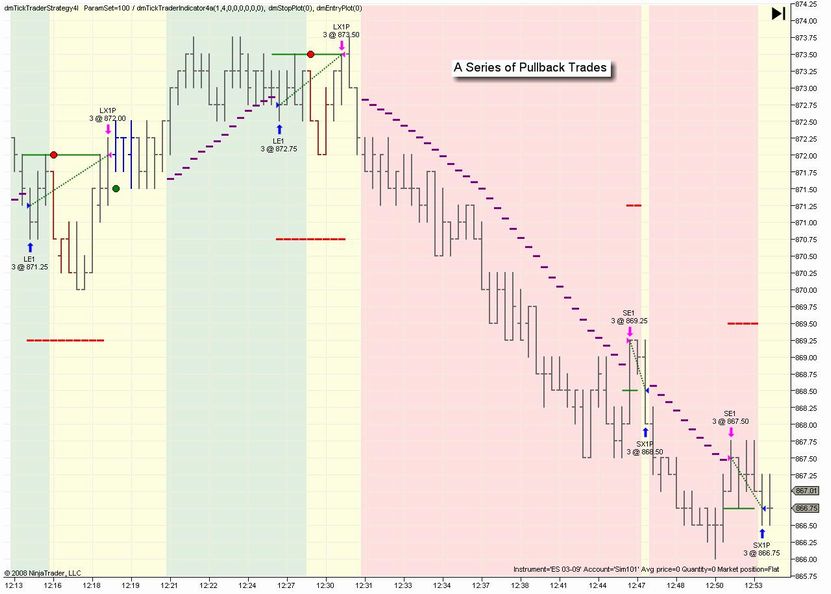
The yellow back coloring again tells us to avoid NSE Trades. When the back coloring goes away, we are officially out of No Zone. The NSE that followed was a short trade and it was a winning trade! Again, ETS ProIndicatorV2 shows all 3 of our trading strategies: NSE Trade / EET Trade/ Pullback Trade. You can learn more about the ETS ProIndicatorV2 in the video below! ProIndicatorV2 Introduction Video Let's shift gears for a moment and apply ProIndicatorV2 to a Dow Emini chart. Many students enjoy our Dow Emini System; you can learn more about that here. Here's the Dow Emini chart: 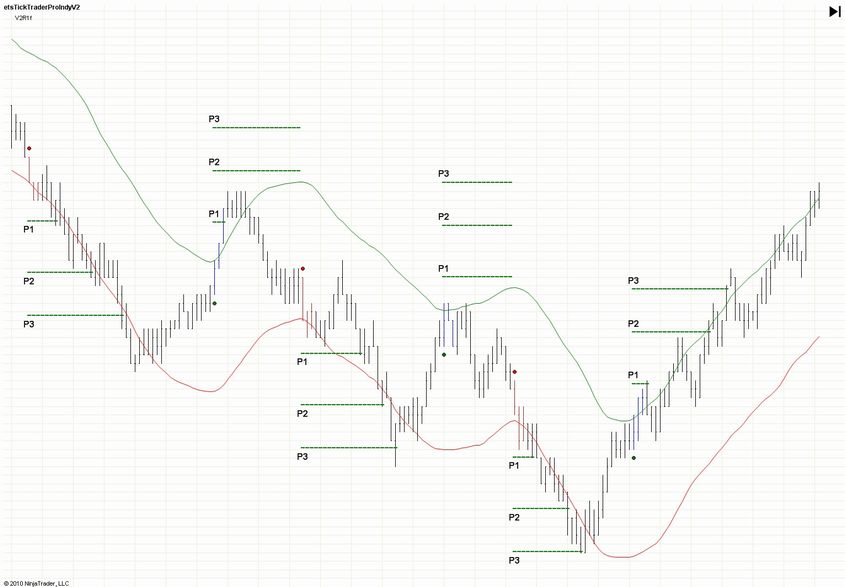
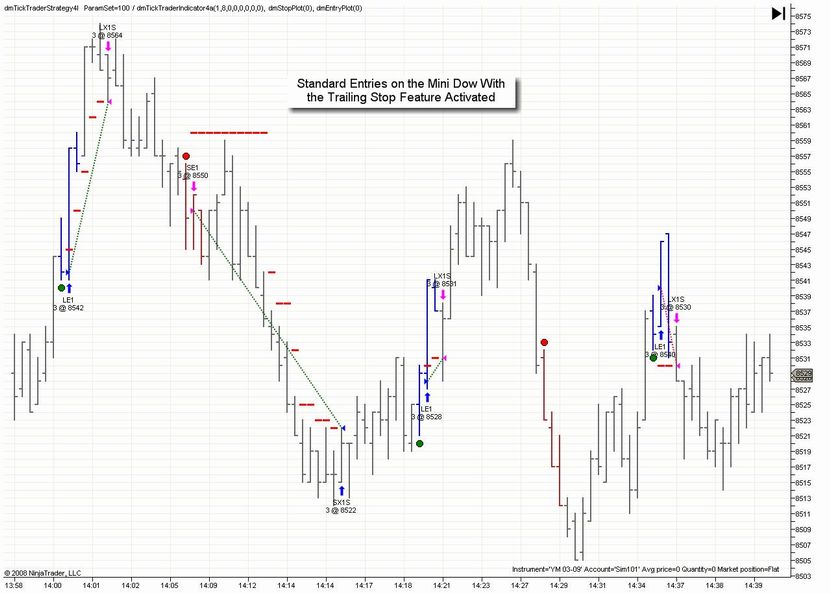
You may notice this Dow Emini chart looks a little different than the emini S&P charts above. The ETS ProIndicatorV2 has some great features that work great using our Dow Emini Strategy. First, you will see 2 lines that flow with the market. These lines show us where we take our worst case entry on the trade! On a short trade, for example, we want our fill above the lower line, and in a long trade the order would be placed below the line. You may also notice the P1/P2/P3 lines. These are Profit Targets (user defined) and act as a nice visual aid to define specific exit levels. The Dow Emini Market tends to trends more than the Emini S&P market and we teach how to scale out of trades accordingly utilizing our Dow Strategy. The Profit Target lines plotted by ProIndicatorV2 are a nice touch! Finally, you can also check out our live trading videos illustrating real trades, on a real trading account using ProIndicatorV2 by visiting our Day Trading Blog. As you can see, ETS ProIndicatorV2 is a great software program! It truly is an incredible tool to help students of The Tick Trader Day Trading Course. ETS ProIndicatorV2 is designed for the NinjaTrader 6.5 Platform. ETS ProIndicatorV2 is sold on a permanent or a yearly lease! For pricing information or to order ETS ProIndicatorV2 with The Tick Trader Day Trading Course, Go to our Order Page. |
| Home | Live Training |
PTS Trader Strategy |
Ninja Trader |
Automated Trading |
Beginners' Info |
Order Now |
FAQs | Blog | Resources | Member Login |
|
NinjaTrader.com | Investors.com | Traders.com | Privacy Policy & Contact Copyright ©2007 - Insight One LLC Small Business Websites by Xisle Graphix |
|
DISCLAIMER: Futures and options trading involves substantial risk of loss and is not suitable for every investor. The valuation of futures and options may fluctuate, and, as a result, clients may lose more than their original investment. The impact of seasonal and geopolitical events is already factored into market prices. The highly leveraged nature of futures trading means that small market movements will have a great impact on your trading account and this can work against you, leading to large losses or can work for you, leading to large gains. If the market moves against you, you may sustain a total loss greater than the amount you deposited into your account.
You are responsible for all the risks and financial resources you use and for the chosen trading system. You should not engage in trading unless you fully understand the nature of the transactions you are entering into and the extent of your exposure to loss. If you do not fully understand these risks you must seek independent advice from your financial advisor. All trading strategies are used at your own risk. This software should not be relied upon as advice or construed as providing recommendations of any kind. It is your responsibility to confirm and decide which trades to make. Trade only with risk capital; that is, trade with money that, if lost, will not adversely impact your lifestyle and your ability to meet your financial obligations. Past results are no indication of future performance. In no event should the content of this correspondence be construed as an express or implied promise, guarantee or implication from Insight One LLC that you will profit or that losses can or will be limited in any manner whatsoever. Insight One LLC is not responsible for any losses incurred as a result of using any of our trading strategies and software. The AutoTrader should never be left unattended due to the possibility of events out of your control, such as computer or data failure, power outages, position mismatches, and/or network problems. Loss-limiting strategies such as stop loss orders may not be effective because market conditions or technological issues may make it impossible to execute such orders. Likewise, strategies using combinations of options and/or futures positions such as "spread" or "straddle" trades may be just as risky as simple long and short positions. Information provided in this correspondence is intended solely for informational purposes and is obtained from sources believed to be reliable. Information is in no way guaranteed. No guarantee of any kind is implied or possible where projections of future conditions are attempted. |