It is a requisite that you understand the basics of day trading before you purchase my course. If you are unfamiliar with the S&P 500 Eminis or terms and phrases like Ticks, Margins, Contracts, etc. then read on. I am going to give you the basics. You can find definitions to common terms on my Glossary Page.
Realize, however it's not entirely necessary to know the complete ins and outs. Most of us really don't know how our cars start in the morning. Some of us (like me) don't even care; I just care that it starts!
That said, here are a few things you need to know.
First off, I am a Stock Index Trader. A Stock Index is an average price of the stocks that are included in that index. For example: You have probably heard of the "DOW"—it's talked about on the news any time it has a large move up or down. Well the Dow, or its complete name, The Dow Jones Industrial Average, is really the average price of the 30 stocks in its index. It's price-weighted, meaning some stocks in the index have more "pull" than the others.
I trade the S&P 500 E-minis. This is a Stock Index of Standard & Poor's 500 stocks. It, like the Dow, is price weighted—some of the stocks have more "weight" or "pull" than others meaning some stocks move the index more than others.
Because the S&P 500 is a "broad" market, it is watched quite closely by a diverse group of interested investors. Many other investment vehicles (mutual funds, IRAs, etc.) gauge their performance to the S&P 500.
I prefer to trade the S&P 500 Eminis as opposed to the "big" S&P 500. The "big" S&P 500 is still traded in an actual "open outcry" Pit in Chicago, at the Chicago Mercantile Exchange, www.cme.com. To trade one contract of the big S&P requires roughly 25 thousand dollars margin per contract.
The S&P 500 E mini is a totally electronically traded market, Hence the "E" in E minis. It is also traded in fractions of the Big S&P, hence MINIS. The margin requirements on the Emini contracts are usually $500 to $1000. The E-minis are a separate market from the big S&P, but the Eminis usually mirror the performance of the Big S&P.
Although the S&P 500 Eminis are a stock index, they are not traded at the stock market. The S&P 500 is a Futures contract, and therefore you buy and sell futures contracts. A futures contract is an agreement between a buyer and seller to deliver commodities by a certain day. For example, if you bought a futures contract of corn, and you held your contract to expiration (delivery) you would be physically delivered your corn. Of course, you probably didn't buy the corn to take delivery of 5000 bushels yourself. More than likely you speculated future prices of corn to go up in value so you bought it only to sell at a later date, before expiration. You can buy and sell any futures contract any time you want, you are not obligated to hold onto it. The good news is, the S&P 500 is a CASH MARKET. Nothing really gets delivered. At expiration you are simply profitable or not. It's traded as a futures contract to provide a hedging vehicle for those with exposure in the stock market and it's traded as a futures contract for speculative purposes.
You are not limited to trade just the S&P 500 Eminis. There are several other Emini markets available. You can trade Dow Minis, E Russell Minis, NASDAQ Minis. The Tick Trader Techniques work for all the Emini markets.
The reason I trade the S&P 500 E-minis, is because it is very liquid—meaning it has a lot of volume and a lot of action. A lot of volume means we can get in and out very quickly.
The minimum price movement the S&P 500 Eminis can make is called a TICK. A Tick is worth $12.50 (per contract). 4 ticks make a complete point in the S&P Eminis, meaning one point is worth $50.00 (per contract). You can trade as many contracts as you like, providing you have the trading capital to do so. To trade the S&P Eminis you are going to have to open up a Futures Trading Account with a Futures Broker. You complete the required account opening documents and study the disclosures provided. Upon acceptance of the account by your futures broker, you will be instructed on how to fund the account. Remember that trading carries a substantial risk of loss and is not suitable for every investor. Only trade with risk capital.
Your broker will tell you how much MARGIN is required to trade the S&P 500 Eminis. For day trading, the margins are usually $500.00 to $1000.00 per contract. So a $20,000.00 account can trade 20 to 40 contracts. Margin is really a "good faith deposit" that protects your broker in case your trade moves against you. That "deposit" gets returned to you once you close out the trade.
As Tick Trader's we are targeting one S&P Emini point a day. Remember, a point is $50 per contract. You need to decide how many contracts you are comfortable with. Please see my Business Plan chart which shows a hypothetical example of how starting off trading 1 contract can plausibly escalate to a nice income in a few short months.
The methods you will learn in my Emini Trading Course give you the potential to make money when the market goes up and when the market goes down. However, it is impossible to predict the actions of the market and therefore, we make no guarantee that you will make money. There is always the risk of loss. Only trade with risk capital.
When you speculate the market will go up, and you initiate a trade, it is called "going long" (good old fashioned buy low, sell high). First you BUY a contract to OPEN a new position. When the price reaches your target you SELL the contract to CLOSE the position.
It's a little different when we speculate the market is going to go down. This is called "shorting the market". In this circumstance we will SELL to OPEN and BUY to CLOSE.
Don't allow yourself to get confused about shorting the market. It's really quite simple as I will explain below.
Let me go into some detail. Trading the S&P 500 E-minis is a ZERO SUM GAME—meaning it is impossible for both players to win. When you buy a contract somebody had to sell it to you. If you win $1000.00 somebody lost $1000.00.
Here is an example of shorting to help you better understand. I am going to use a stock market trade for simplicity. Suppose Dell Computer is trading at $50 a share. You know that Dell's earnings report is coming out tomorrow and you speculate that Dell stocks will go down in value and you would like to profit from that downward movement. So you want to "Short 1000 shares". In other words, sell the shares to someone else. But you don't have any Dell shares to sell, so how can you do it?
You BORROW THEM from your broker. You call your broker and tell him (or her) that you wish to Short-sell 1000 shares of DELL at $50 a share. You then sell them to somebody (we'll never know who it is) and $50,000 comes into YOUR ACCOUNT, (1000 shares x $50) but you can't spend that money! Remember you borrowed 1000 shares of Dell from your broker and he wants his shares back.
He doesn't care at what price you get the shares; he just cares about getting them back.
The next day, Dell goes down to $45 a share. Great! You take $45,000 of the $50,000 you received from the short-sale and go buy 1000 shares on the open market at $45 a share. You give the broker back his shares, and you keep what's left of the original $50,000, or $5,000.
When we trade the eminis, we don't trade shares, we trade contracts. The above was an illustrative example of the stock market. In the futures, we simply go long futures contracts and short futures contracts. A good example: We may speculate that the eminis are going to appreciate in value. Let's assume we place a long trade at 845.00—we sell at 846.00 for a 1 point profit. If you believe the eminis will go down in value you would short at 845.00 and buy to close at 844.00 for a 1 point profit!
That is just an illustrative story to help you better understand shorting. Of course, all this is done very quickly and electronically. You don't actually call and ask to borrow futures contracts. It's all done for you—all you do is click the appropriate button on your trading platform!
Remember: there is always two sides to your position. You either Buy to Open / Sell to Close (meaning your going LONG) or Sell to Open / Buy to Close (going short)
That's basically it. All you really need to know about it is that you can speculate the price will go down and make money if it does if you are short the future, just as you can speculate that the price will go up and make money if you are long the future. Remember, though, if you speculate incorrectly on the short or the long side, you will lose money.
So far we've covered what we trade, why we trade it, and that we can make money going UP and we can make money going DOWN.
Let's look at a chart to see what it all looks like. This is a chart I created using a program called NinjaTrader. In my opinion it is the best charting program available. Contact me if you are interested in a FREE trial of NinjaTrader!
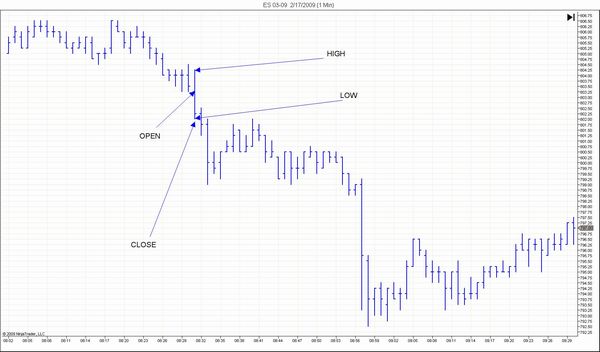
This is a 1 minute bar chart. Meaning, every bar is one minute worth of time. You will notice that every bar has a little "leg" to the left and to the right. The Leg to the Left is the Opening price of that bar and the leg to the right is the closing price. The top of the bar is the High of the bar and the bottom is the Low. That's it! This, by the way is called an OHLC Chart — Open High Low Close.
Some people use "Candlestick" charts as opposed to OHLC. A Candlestick charts still show price action like the OHLC charts do, but they do it in a very unique way. You can read volumes of books on just Candlestick charting and what they mean. Personally, I stick with OHLC. They are very simple to read and easy to use.
I use a chart similar to this one to trade every day. I add a couple of "technical indicators" to my charts to help me determine which way the market will go. There are literally thousands of indicators you can use. Each indicator is unique in its own way and tries to help you determine what price action is going to do next.
In my Emini Daytrading Course, The Tick Trader, I use two basic, easy to learn indicators. I place these indicators right on the chart shown above and I know EXACTLY when to Go Long and when to Go Short.
The Tick Trader Day Trading Course comes with Comprehensive Online Training Videos, Downloadable Training, and Daily Videos, as well as access to our Live Trading Room, and Member's Only Message Forum. My emini videos show "real" trades that I actually made. I do not cherry pick and only show the good trades! I show the winners and the losers. I teach you precise entry and exit techniques. In order for a trading course to work, it has to work TODAY. That's why I always use current trades when teaching you. Watch my videos a few times and this will become crystal clear to you. Of course you will always have access to my Member's Area where I will post daily videos to show the trades. You will learn from these trading videos even if you are a veteran trader.
I stand behind my methods. I want you to use this to make your living every day. If you ever have questions, just email us—we'll promptly answer your questions!
We are truly here to help you learn to day trade the emini markets! We are committed to your success and will always answer all your questions. After a few weeks of coming to The Live Trading Room, and watching Daily Videos—you will know everything you need to know about trading the eminis. You probably will
 Our YouTube Channel

DISCLAIMER: Futures and options trading involves substantial risk of loss and is not suitable for every investor. The valuation of futures and options may fluctuate, and, as a result, clients may lose more than their original investment. The impact of seasonal and geopolitical events is already factored into market prices. The highly leveraged nature of futures trading means that small market movements will have a great impact on your trading account and this can work against you, leading to large losses or can work for you, leading to large gains. If the market moves against you, you may sustain a total loss greater than the amount you deposited into your account.
You are responsible for all the risks and financial resources you use and for the chosen trading system. You should not engage in trading unless you fully understand the nature of the transactions you are entering into and the extent of your exposure to loss. If you do not fully understand these risks you must seek independent advice from your financial advisor. All trading strategies are used at your own risk. This software should not be relied upon as advice or construed as providing recommendations of any kind. It is your responsibility to confirm and decide which trades to make. Trade only with risk capital; that is, trade with money that, if lost, will not adversely impact your lifestyle and your ability to meet your financial obligations.
Past results are no indication of future performance.
In no event should the content of this correspondence be construed as an express or implied promise, guarantee or implication from Insight One LLC that you will profit or that losses can or will be limited in any manner whatsoever. Insight One LLC is not responsible for any losses incurred as a result of using any of our trading strategies and software. The AutoTrader should never be left unattended due to the possibility of events out of your control, such as computer or data failure, power outages, position mismatches, and/or network problems. Loss-limiting strategies such as stop loss orders may not be effective because market conditions or technological issues may make it impossible to execute such orders. Likewise, strategies using combinations of options and/or futures positions such as "spread" or "straddle" trades may be just as risky as simple long and short positions. Information provided in this correspondence is intended solely for informational purposes and is obtained from sources believed to be reliable. Information is in no way guaranteed. No guarantee of any kind is implied or possible where projections of future conditions are attempted.
Live Trade Room: Any and all live presentations are for educational purposes only and the opinions expressed are those of the presenter only. All trades presented should be considered hypothetical and should not be expected to be replicated in a live trading account.